How to Detect Fairness in Computer Vision AI: A Hands-On Exploration

18/09/2025
18 MIN READ /
As AI systems become embedded in real-world decisions—from recruitment to security and customer experience—the stakes for ensuring fairness and accountability have never been higher. For organizations working with computer vision (CV) systems, the challenge is even more complex.
Unlike traditional AI models trained on structured tabular data, visual AI operates on vast arrays of pixel data—often millions of features per image—without predefined labels or metadata. These images must be manually annotated, a process that is time-consuming, error-prone, and typically optimized for accuracy, not fairness.
That’s a problem. When fairness isn’t explicitly considered during labeling or model development, the risk of demographic bias, performance gaps across user groups, and real-world harm increases dramatically.
And while regulatory frameworks like the EU AI Act and NYC Bias Law are now making fairness legally required in many high-risk domains, the business case for fairness goes far beyond compliance. Ensuring that your models treat users equitably:
- Builds trust with customers, partners, and stakeholders
- Reduces reputational and litigation risk
- Increases model generalizability and robustness
- Supports ethical, inclusive innovation
In this article, we explore one practical way to tackle this challenge: leveraging benchmark datasets—in particular, the FACET database, designed to help organizations evaluate visual AI systems for fairness even when demographic labels weren’t originally collected.
Fairness and bias in the context of machine learning
To set the scene, we start from the definitions of Bias and Fairness with regards to Visual AI systems (and AI systems in general).
Bias – Whether the model is consistently underperforming by giving importance on specific input features rather than others to make a prediction.
Attention: The statistical notion of bias is different to the AI definition above, statistical bias arises when the selection of the model is not representative of the problem and makes incorrect assumptions (like linearity), leading to consistent errors, regardless of the training data.
Fairness (related to humans) – Whether the outcome of the prediction (not the model’s performance), is fair for different demographic group slices.
Note: A model might be biased, but fair, (e.g. when assigning test scores, if it takes into account the limited resources, background of an individual before it reports the test score results). This specific example can sometimes be called ‘positive bias’.
In the following analysis we will assume that the system is designed as such so that the correct detection of a human in a visual AI model, will lead to a positive outcome. Therefore, any bias detected in the sensitive input features (e.g. age, race, gender) will also constitute a fairness problem for the AI system as the model will not be able to detect them and therefore the AI system will not be able to provide them with a positive outcome.
The problem in detecting bias and fairness in Visual AI
Now that the definitions are out of the way and we have set the scene, how does one go about detecting Bias – Fairness issues in Visual AI systems?
Detecting bias:
Let us first look at how bias is identified in ‘tabular AI’ systems which is generally more straightforward than in Visual AI data.
Due to the structured, interpretable nature of tabular features, where protected attributes (like race or gender) are often explicitly labeled, bias in tabular data can be straightforwardly detected using statistical analysis, visualization, and feature attribution techniques like SHAP or LIME. code4thought has also created a proprietary method for providing explanations based on SHAP called MASHAP which is exclusively available on the iQ4AI platform (See our publications [1] and [2]).
The SHAP technique produces a weight for each of the features of the tabular data, that represents the amount it contributed to the final output. An example of such a result is shown in Figure 1 using code4thought’s proprietary iQ4AI platform.
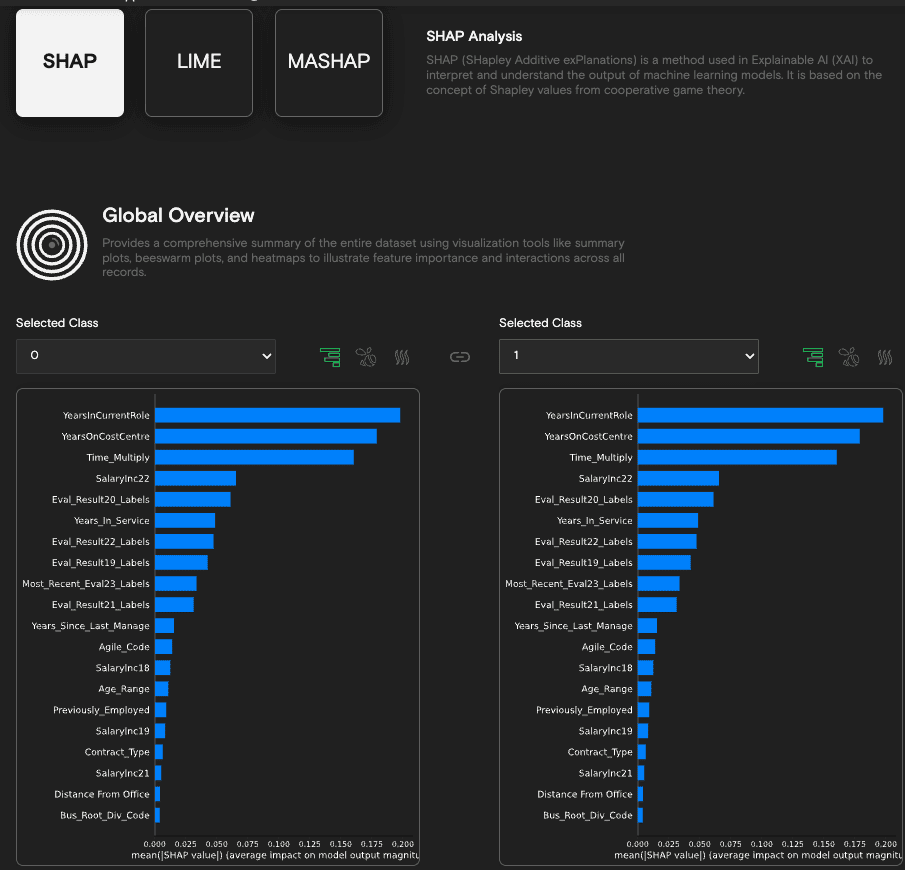
Figure 1. SHAP explainability results obtained by code4thought’s iQ4AI platform,
for a binary classification problem on tabular data.
In contrast to tabular AI systems, image data ingested in Visual AI systems is both unstructured and orders of magnitude higher in input feature dimensionality. Whereas tabular data may typically have 20-100 features per sample, the input features available in images depend on the number of pixels in the image and are the scale of 10^6 features per sample.
It is not only the much larger amount of features in images that complicates things, but as previously mentioned, the unstructured nature of the data (pixels) as well. Therefore, they need to be labelled after data collection, in contrast to tabular data, which usually have the label of the feature already integrated in the database.
Detecting fairness:
What is more, even after image data is being labelled, aspects useful for fairness evaluation of the AI system (such as a person’s perceived age, perceived skin tone and perceived gender) are usually omitted due to development time and labelling cost constraints. Only labels which are explicitly relevant to the application are added (e.g. person, car, bird) making bias detection more complex. Protected attributes may not be labeled and are often embedded visually, requiring tools like Grad-CAM or saliency maps to interpret what the model is focusing on. As a result, detecting and explaining bias in image models often involves inferring demographic cues and analyzing indirect visual proxies, which is inherently more challenging.
Finally, in the detection of fairness, deep knowledge of how the model will be used within the AI system is required to understand how input feature bias leads to particular fairness outcomes (or not). This explanation is even more difficult to ascertain as it requires specialist domain knowledge and the developer of the AI system to have this clearly described in their instructions for use. In this analysis as mentioned before to keep things simple, we will assume that any bias problem detected in the input label features leads to a fairness problem in the predictions of the Visual AI network.
The solution?
Solving this riddle can come from different directions:
1. The ideal solution would be to instigate a paradigm shift for companies and individuals generating training datasets that image data labels, which affect or could affect human lives (e.g. for health, security, monitoring systems), should always include fairness-relevant aspects alongside the application-relevant labels, so that the fairness of a Visual AI system can be verified with the data used for training the dataset itself.
This paradigm shift could be enforced by making it obligatory in relevant legislation for example the EU AI Act. However, the current version of the EU AI Act does not require that developers of AI Systems to include demographic and sensitive data to their training and testing datasets. It remains to be seen if such requirements will become obligatory, either in the form of complementary legislation or as new appendices to the current EU AI Act framework.
2. A specific “Fairness Auto Labelling Visual AI network” could be developed or used to enrich existing or older datasets with fairness data, without going through the hassle of manual relabelling. If such an AI model existed, it could greatly assist efforts of companies trying to prove to their clients that both the data that their models are trained on, but also the outcomes of their models achieve fairness with respect to different demographic groups.
Such auto-labelling AI networks exist, but to our knowledge do not have the ability to be as ‘auto’ as one would expect from their title. They do perform really well and save lots of time and money from the process of manual labelling, but still contain inconsistencies and ‘blind spots’, which would have to be compensated for by a human being, validating the results.
3. Another solution, which is not ideal both for AI model developers and users at the moment, as it is not entirely representative of the use and purpose of the AI model, but is readily available, is to assess the performance of the Visual AI network in relation to a ‘golden standard’ (i.e. benchmark dataset). This solution is less than optimal because the available data in the dataset might be far from the use case of the AI model, skewing the true fairness performance of the AI network from its true value.
Nevertheless, benchmark datasets are readily available and easily used, much more so than the first two solutions suggested, so we will go through such an example. More specifically, we will be investigating the use of the FACET benchmark dataset to evaluate the bias / fairness of a localization visual AI network, specifically Yolov5m trained on the Coco dataset.
Using the FACET database as a benchmark
The FACET database
In January 2023, Meta AI released FACET (FAirness in Computer Vision EvaluaTion), a large-scale benchmark dataset for assessing fairness issues in computer vision models, particularly those related to human recognition, localisation and classification tasks in images.
FACET is designed to evaluate how equitably models perform across various demographic subgroups by including ‘sensitive data’ labels with reference to age, gender and skin tone among others.
Some key details of the FACET dataset:
- Size: ~32,000 images and ~50,000 people bounding boxes.
- Evaluation Annotations: 52 person-related classes, bounding boxes around each person, and 69,000 segmentation masks of person/hair/clothing.
- Protected Groups: Perceived skin tone, perceived age group and perceived gender presentation.
- Additional Person Attributes: Hair color, hair type, facial hair, accessories (headscarf, face mask, hat) and tattoos.
- Miscellaneous Attributes: Lighting condition and level of occlusion.
- Annotators: Expert reviewers sourced from multiple geographic regions (North and Latin America, Middle East, Africa, East and Southeast Asia), with 6 different geographic regions represented (United States, Colombia, Egypt, Kenya, Philippines, Taiwan).
Types of Visual AI networks which can be evaluated using the FACET dataset as a benchmark
The FACET database proves both bounding box labels as well as segmentation maps, therefore in principle two types of common visual AI networks can be evaluated :
1. localization networks (outputs a bounding box and a category label) [Figure 2]

Figure 2. Example of a bounding box output from the FACET dataset
2. segmentation networks (outputs a segmentation mask and a label) [Figure 3]
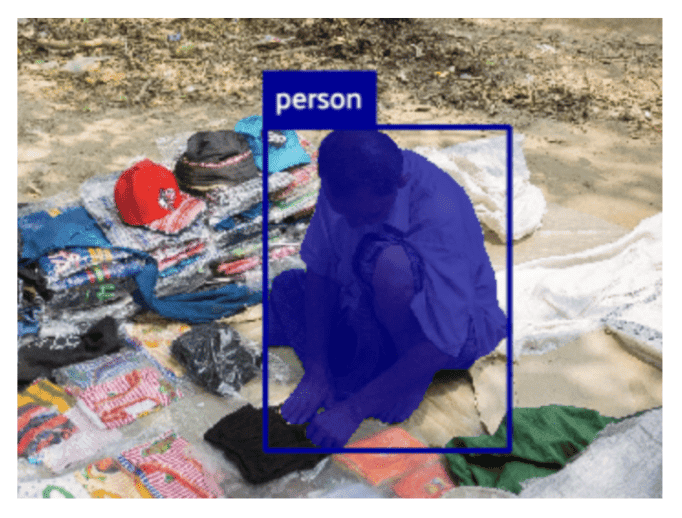
Figure 3. Example of a segmentation mask output from the FACET dataset
In our case study, we are evaluating Yolov5m, a localization network outputting a bounding box and label.
Exploratory analysis of the FACET dataset
By analysing the FACET dataset, we got the following metrics:
- Samples / Images: 31.702 (total number of photographs in database)
- Annotations:
- ‘Person’ Bounding box detections: 49.551 available in total (number of person bounding boxes available in all photographs). Contains demographic information such as perceived age.
- Segmentation masks: 69.105 segmentation masks available in total, out of which only 11.014 are ‘Person’ segmentation masks. The rest of the segmentation masks are segmentations of parts of the person, which are not of interest to this investigation (e.g. ‘Hair’ 7.224, ‘Clothes’ 50.867).
Therefore we see that the bounding box annotations, which contain the sensitive demographic and segmentation masks in FACET, do not seem to be balanced with the available segmentation masks in the category ‘person’.
This imbalance could be analysed in detail in a future article, in our current example, however, and since the model which we are evaluating (Yolov5m) is a bounding box application, we can use the 49.551 available person bounding box annotation labels directly for our evaluation.
Evaluation plan, setting test assumptions and constraints
In this evaluation, we do not use the Visual AI image features (pixels, shapes, patterns) per se in the bias / fairness analysis. Instead, we conduct a secondary proxy bias analysis on the ground truth attributes.
The metric we will use for this evaluation is to measure the true positive rate for all the sensitive attributes we mentioned before (perceived age, perceived gender, perceived skin color). We will therefore see out of all the labels with a specific sensitive category value what percentage of the results is re
AI Network Evaluated: Yolov5m, a visual model produced bounding box outputs.
Focus placed on Fairness, rather than the Performance
It was noticed that the FACET database does not label all human instances in each of the samples. Since we cannot therefore evaluate the additional predictions the model makes, we isolate the evaluation on the predictions done for which FACET ground truth is available, and ignore all other predictions made by the model.
This is therefore quite unfair on the model as it does not evaluate its true performance but this is a common trade-off when using benchmark datasets to evaluate models, as mentioned in the beginning.
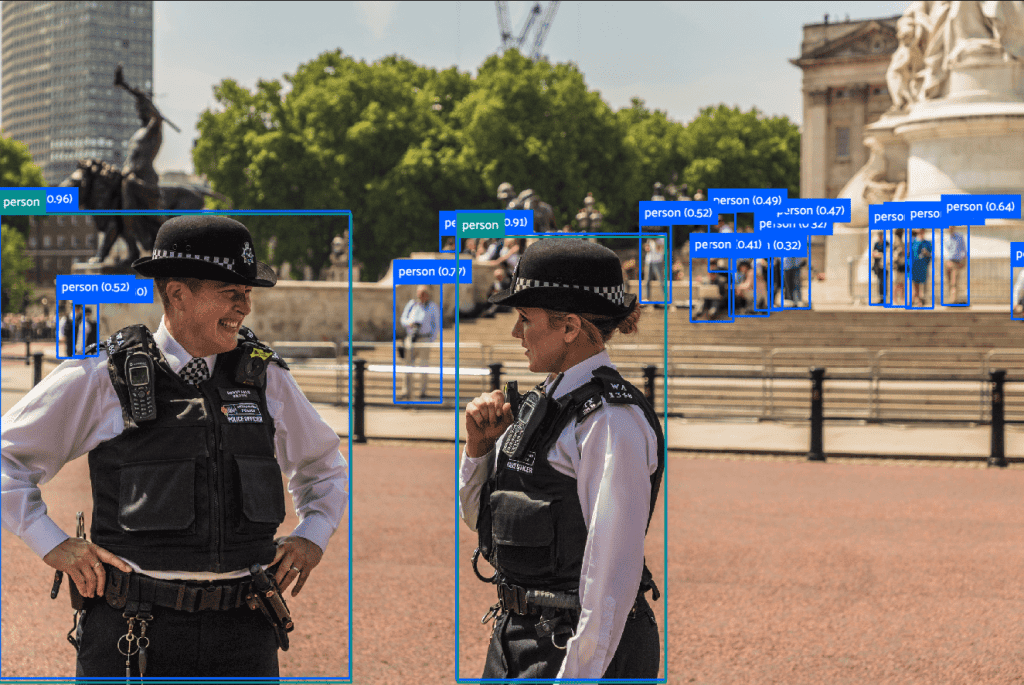
Figure 4. Example of disparity between Yolov5m ‘Person’ predictions (blue) and available FACET labels (green) in an image sample.
FACET – Yolov5m label mapping
To associate the labels which exist in FACET for the ground truth bounding boxes (‘policeman’ , ‘carpenter’ , ‘sportsman’) to the results coming form the Yolov5m network which only has a general ‘person’, a mapping of all the FACET label categories was done to a supercategory named ‘person’.
This way labels can be easily compared in terms of IOU (Intersection over Union) and the true positive rate of the different categories we would like to investigate in the ground data could be calculated.
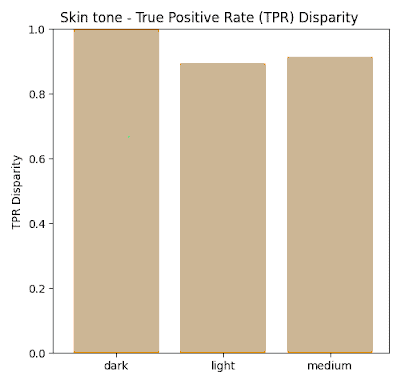
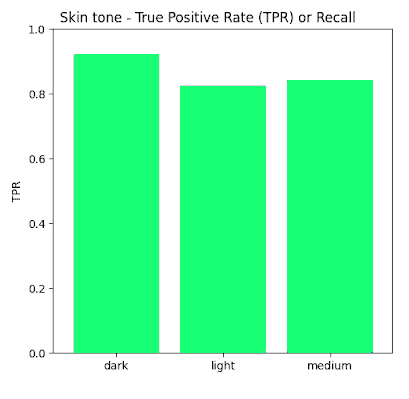
Skin tone: Regarding skin tone, the FACET dataset records skin tone on a scale between 1 (light) – 10 (dark). We felt this scale was too fine, and not intuitive enough so the skin tone ground truth was grouped as follows: 1-3 was mapped to ‘light’, 4-7 was mapped to ‘medium’ , 8-10 was mapped to ‘dark’.
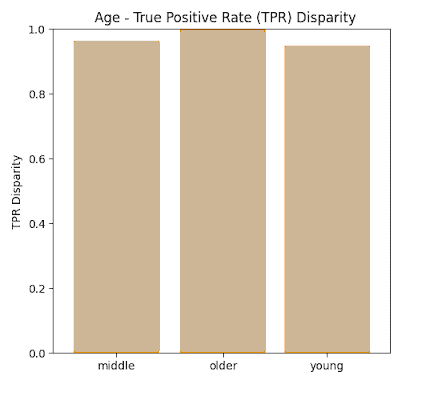
True Positive Rate Results
In this section we present the true positive rates calculated for each of the sensitive categories both in absolute terms (Recall) as well as Disparity whereby maximum normalization to 1 was achieved.
Proxy Fairness results
By ‘proxy’ fairness analysis we highlight the fact that the results acquired in the previous section look at the FACET label and not the actual inputs (pixels) to the Visual AI network to extract observations.
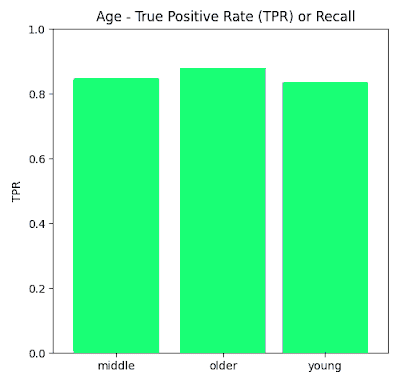
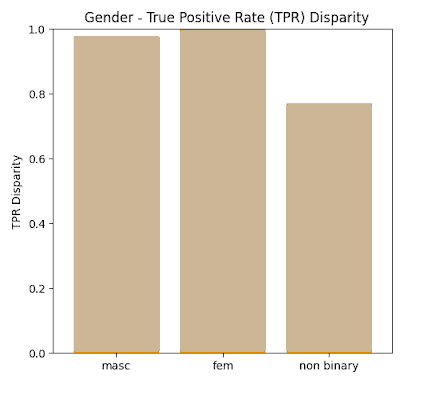
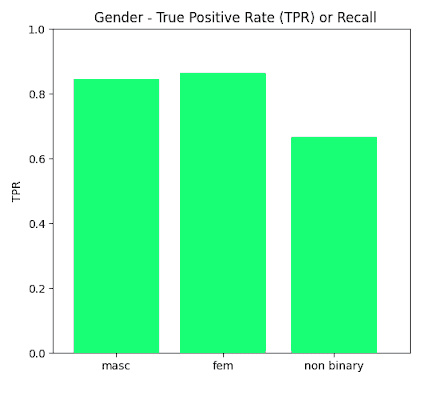
By analysis at the labels of the FACET database ground truth and defining the true positive as a match between ground truth and prediction that with an IOU of >0.5, the True Positive rates shown in the previous section were acquired for the sensitive data label categories investigated such as Perceived Gender (Male, Female Non-Binary) , Perceived Skin tone (Dark, Medium, Light), and Perceived Age (Young, Middle, Older).
It is shown that disparities between all values remain within 80% of each other (4/5th rule) except for the Νon-Βinary category in the Gender label. One possible explanation for this result is that the non-binary ground truth data was a very small percentage of the overall dataset <1%.
Therefore in general, we observe that when using the FACET dataset as a benchmark for a proxy fairness analysis, Yolov5m appears to score very high on fairness across all sensitive parameters which were investigated in this study – namely age , gender and skin tone.
Key Takeaways - From Benchmarking to Actionable Fairness
From the lessons learned during this exercise, we suggest the following to anyone using the FACET database as a quick method to perform proxy or secondary bias / fairness:
- Align the labels between those available in the dataset and the ones produced by your AI model output by grouping them or renaming them.
- Group skin tone ground truth data to easy to understand categories instead of using the FACET numerical scale.
- Filter predictions to keep only the ones which are related to the ground truth bounding box labels available in the dataset, (i.e. focus the assessment on the available labels).
In terms of business results, we should always keep in mind that benchmark datasets albeit an easy way to ‘tick the box’ for fairness evaluation of your AI model, should be representative of the intended application and the real circumstances your model will operate in. Otherwise, the results obtained might skew true fairness metrics to either a higher level or lower level than the actual model’s behavior, rendering your benchmark dataset evaluation void.
For the moment however it is the easiest and fastest common ‘measuring’ stick we have in Visual AI and which should not be dismissed outright as a viable alternative to performing a ‘quick and dirty’ fairness evaluation is that of the use of benchmark datasets such as FACET.
Using benchmark datasets like FACET shifts fairness testing in Visual AI from an abstract ideal to a structured, measurable process, but it must be used with care, and the assumptions made in the process must be valid in order to reflect true real-world performance of the AI system in question. This approach not only supports compliance efforts but also informs better design decisions, highlights potential model limitations, and aligns technical development with broader business priorities such as accountability, inclusivity, and user trust.